
Using pandas isin() method with python holidays package
Published:
When working with a pandas time series, it is useful to know which dates in the time series are public holidays. This information may be used for data analysis, feature construction, improving models, etc.
Pandas has a built-in calendar for identifying US Federal Holidays. However if you live elsewhere in the world, you are out of luck - pandas requires that you manually create a holiday calendar for other countries.
Thankfully a superb Python package called holidays has your back. Holidays offers fast and efficient evaluation of holiday dates for over 80 countries worldwide. Using holidays is simple:
import holidays

# Create a dict-like object for England's public holidays
uk_holidays = holidays.UK(subdiv="England")

# Check some dates:
"2022-04-15" in uk_holidays  # True, Good Friday 2022
"2022-04-14" in uk_holidays  # False, the day before is just a normal working day
Holidays automatically calculates on-the-fly whether a date is a public holiday. You do not need to pre-specify the date range you are interested in, although this is possible (see later).
In example so far, holidays has automatically determined all the public holidays in England in 2022:
for key, val in sorted(uk_holidays.items()):
    print(key, val)
Result:
2022-01-01 New Year's Day
2022-01-03 New Year's Day (Observed)
2022-04-15 Good Friday
2022-04-18 Easter Monday
2022-05-02 May Day
2022-06-02 Spring Bank Holiday
2022-06-03 Platinum Jubilee of Elizabeth II
2022-08-29 Late Summer Bank Holiday
2022-12-25 Christmas Day
2022-12-26 Boxing Day
2022-12-27 Christmas Day (Observed)
Pandas time series example
Now lets look at a pandas time series and consider the values on holidays. Lets use a dataset on motorway traffic in England downloaded from WebTRIS. The data is for traffic clockwise per day on the M25 between junctions 21 & 22 in 2021:
import pandas as pd

df = pd.read_csv("m25_traffic_data_2021.csv")
df["Date"] = pd.to_datetime(df["Date"])
df.head()
| Date | Vehicles per day | |
|---|---|---|
| 0 | 2021-01-01 | 15221 |
| 1 | 2021-01-02 | 25920 |
| 2 | 2021-01-03 | 23805 |
| 3 | 2021-01-04 | 43649 |
| 4 | 2021-01-05 | 46113 |
import matplotlib
import matplotlib.pyplot as plt
matplotlib.style.use("seaborn-white")
plt.rcParams["figure.figsize"] = (8.8, 3.6)

ax = df.plot(x="Date", y="Vehicles per day")
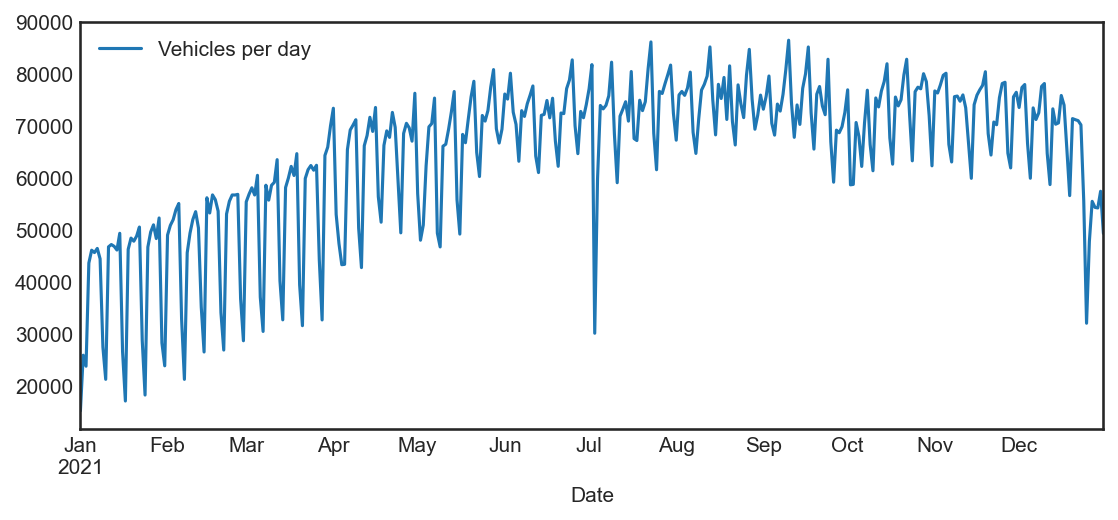
From the time series we can immediately see there is:
- a weekly seasonality,
- an effect of the easing of lockdown restrictions throughout early 2021,
- a sensor downtime that occurred in early July,
- and effects from the Christmas and New Year holiday periods.
Lets pick out the data on public holidays using the holidays package:
df[df["Date"].isin(uk_holidays)]
| Date | Vehicles per day |
|---|
Oh no! No results are reported and something is clearly wrong.
There is, unfortunately, an incompatibility issue between holidays and the pandas isin() method. It prevents holidays dynamically building its internal calendar on-the-fly.
Broadly there are two ways to circumvent the problem. Let us look at each in turn.
Use apply() & lambda function instead
The issue with the isin() method is that under the hood it is not performing date in uk_holidays. My preferred method instead is to use the apply() method to force such operations explicitly:
df[df["Date"].apply(lambda d: d in uk_holidays)]
| Date | Vehicles per day | |
|---|---|---|
| 0 | 2021-01-01 | 15221 |
| 91 | 2021-04-02 | 52987 |
| 94 | 2021-04-05 | 43391 |
| 122 | 2021-05-03 | 50961 |
| 150 | 2021-05-31 | 69383 |
| 241 | 2021-08-30 | 72068 |
| 358 | 2021-12-25 | 32066 |
| 359 | 2021-12-26 | 47780 |
| 360 | 2021-12-27 | 55506 |
| 361 | 2021-12-28 | 54345 |
Success! Now we have the traffic data on the public holidays. Note the uk_holidays object has also updated with the data on 2021 holidays:
uk_holidays.years # {2021, 2022}
If instead of a column in the data frame, the dates are the index of the data frame, like so:
df2 = df.copy()
df2 = df2.set_index("Date")
df2.head()
| Vehicles per day | |
|---|---|
| Date | |
| 2021-01-01 | 15221 |
| 2021-01-02 | 25920 |
| 2021-01-03 | 23805 |
| 2021-01-04 | 43649 |
| 2021-01-05 | 46113 |
it is possible to use index.map() & the lambda function to select the holiday dates:
df2[df2.index.map(lambda d: d in uk_holidays)]
| Vehicles per day | |
|---|---|
| Date | |
| 2021-01-01 | 15221 |
| 2021-04-02 | 52987 |
| 2021-04-05 | 43391 |
| 2021-05-03 | 50961 |
| 2021-05-31 | 69383 |
| 2021-08-30 | 72068 |
| 2021-12-25 | 32066 |
| 2021-12-26 | 47780 |
| 2021-12-27 | 55506 |
| 2021-12-28 | 54345 |
Pre-specify years to holidays
Instead of relying on on-the-fly calculation of holiday dates, you can initialize the holidays calendar with all the vacation data you need. This way isin() works as expected:
 # Initialize with holidays for 2021 & 2022
uk_holidays = holidays.UK(subdiv="England", years=range(2021, 2022))

df[df["Date"].isin(uk_holidays)]
| Date | Vehicles per day | |
|---|---|---|
| 0 | 2021-01-01 | 15221 |
| 91 | 2021-04-02 | 52987 |
| 94 | 2021-04-05 | 43391 |
| 122 | 2021-05-03 | 50961 |
| 150 | 2021-05-31 | 69383 |
| 241 | 2021-08-30 | 72068 |
| 358 | 2021-12-25 | 32066 |
| 359 | 2021-12-26 | 47780 |
| 360 | 2021-12-27 | 55506 |
| 361 | 2021-12-28 | 54345 |
So this method also works, but it requires you know the full date range of the time series first in order to set up the holidays object.
Bringing it all together
Now we can identify the holiday dates in the time series, let’s plot them on the graph:
df["Holiday traffic"] = df["Vehicles per day"][df["Date"].apply(lambda d: d in uk_holidays)]
ax = df.plot(x="Date", y=["Vehicles per day", "Holiday traffic"], style=["-", "o"])
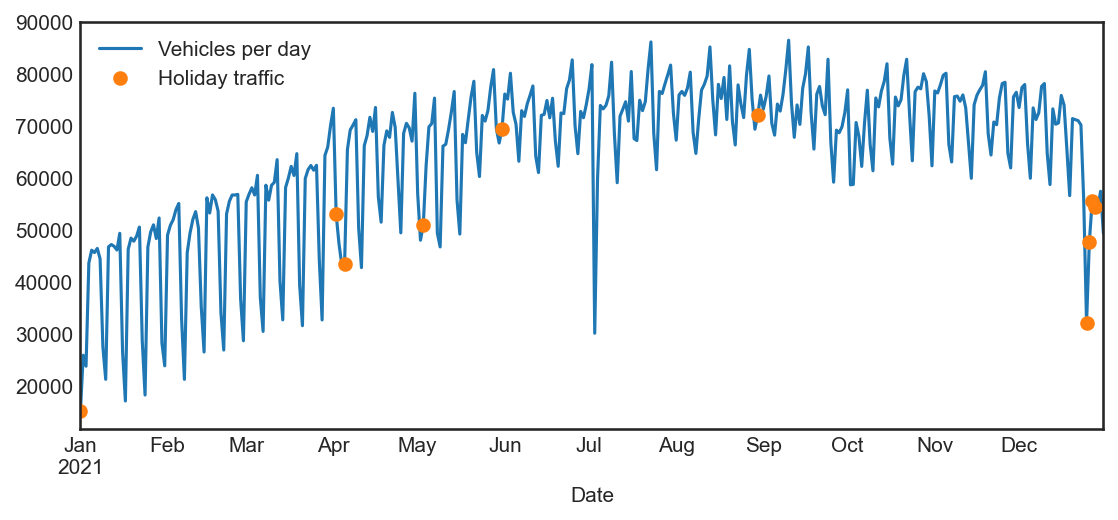
We see that traffic on public holidays on this stretch of motorway is generally lower than the surrounding days.
The holidays package can be used to analyze more deeply the effects of holidays in time series,
TLDR
The pandas isin() method is incompatible with the on-the-fly generation of holiday dates feature of the holidays package.
Use a lambda function and the apply() method instead. Or the index.map() method in your dates are the index of the pandas series / data frame.
Another option is to seed the holidays calendar with all years you are interested in beforehand. This way isin() will work as expected, but take care to seed all years otherwise you will get incorrect results.